Energy Flow Analysis
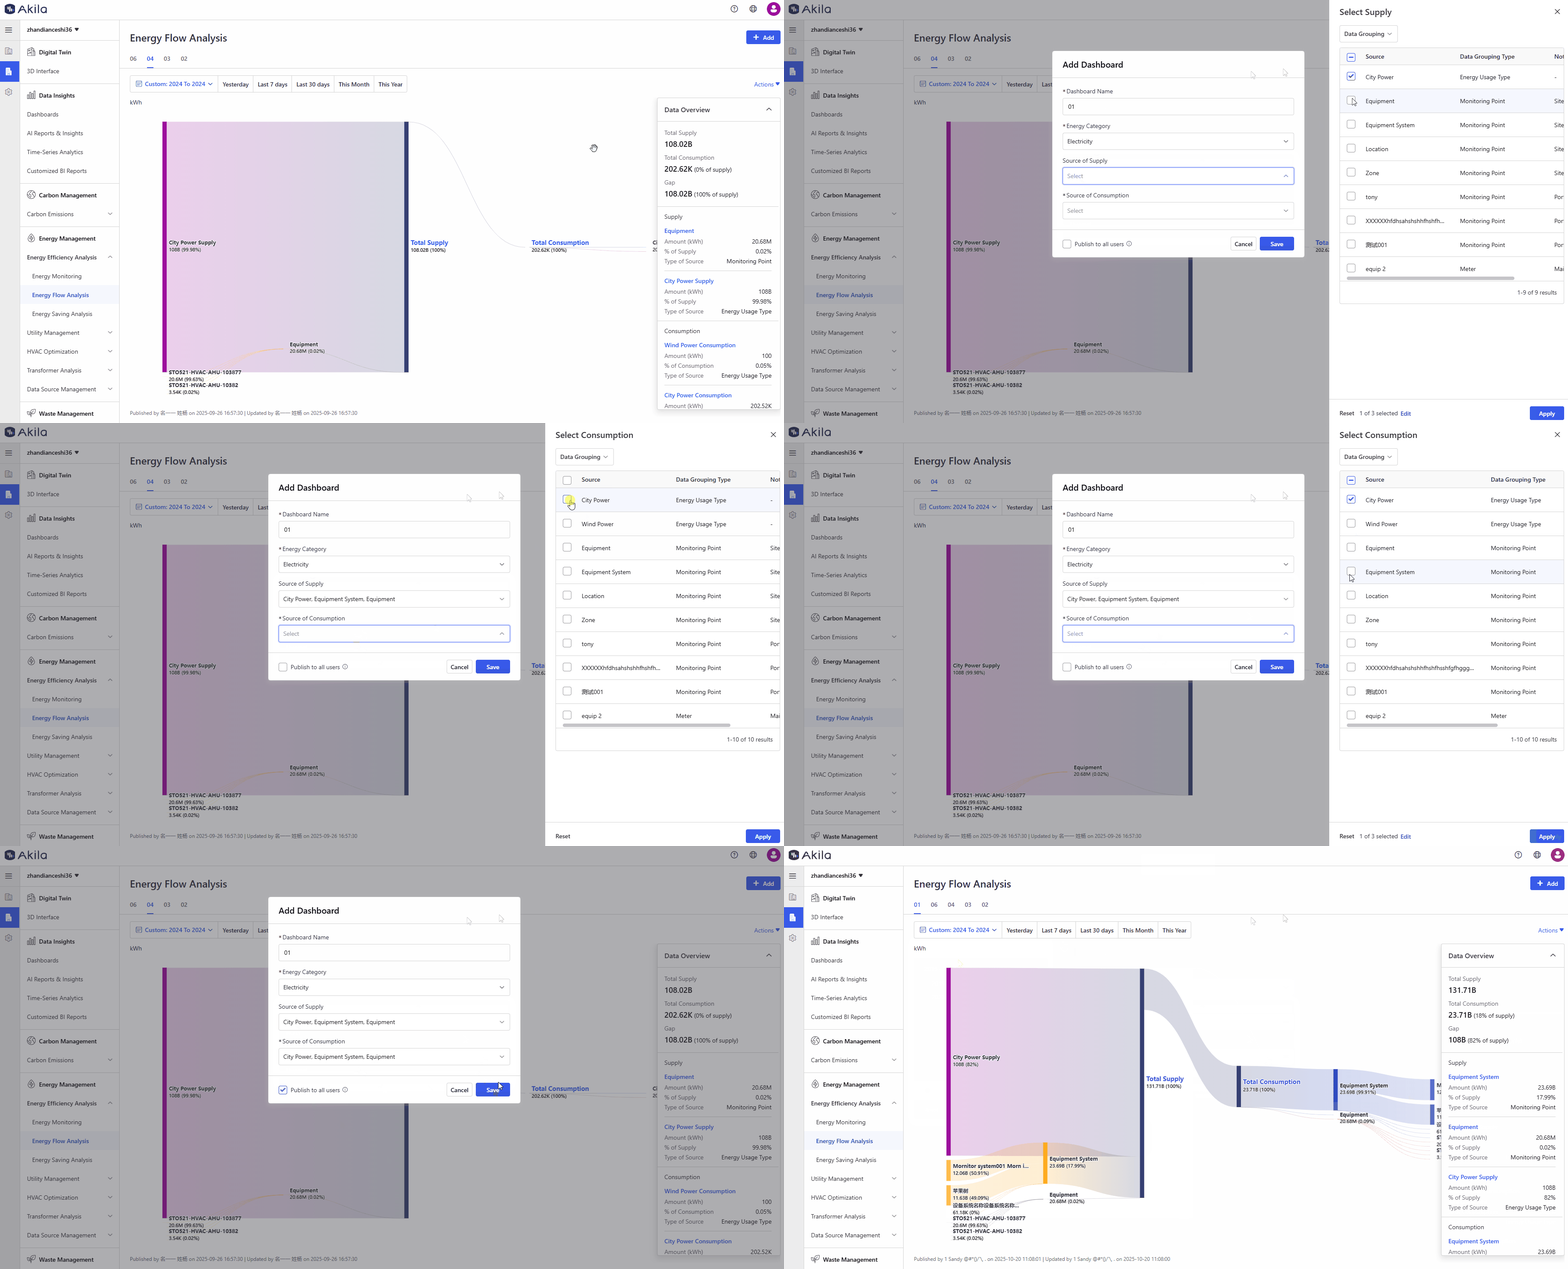
It shows an energy usage hierarchy in different dimensions.
The Energy Flow Analysis module provides a comprehensive visualization tool that maps the complete energy journey from supply sources to end-use consumption across your facility. This powerful feature enables you to clearly track energy distribution patterns, identify inefficiencies, and make data-driven decisions to optimize resource allocation and improve overall energy performance.
You can use it to:
- Track energy flow by viewing electricity, water, gas and heat.
- Quickly pinpoint energy losses and wasteful consumption patterns
- Monitor the effectiveness of energy conservation measures over time
Add Dashboard
- Click "+Add" on the top right corner
- Input dashboard name
- Select energy category
- Select source of supply or consumption
Note: The source of consumption is a required field as every company will consume energy. If your company has the source of supply, you can also add a new dashboard and fill it. - Select to check "Publish to all users"
Note: If you check it, this dashboard will be visible to all users under one client. You can only check the box when the dashboard number is less than or equal to 10.

View Dashboard
- Click dashboard name
- A vertical line will use to distinguish published and unpublished dashboard. Published dashboard will display before the normal dashboard. If there is no published dashboard, there will be no this line.
- Drag the dashboard name to change the order but the published one cannot be re-ordered.
- Select time range
- A pop-up will show up and display details of consumption or supply
Note: If you click the blue nodes on the pop-up, you can turn to Energy Monitoring page.
Edit Dashboard
- Click Actions and Edit on the top right corner
- Edit any filed in the pop-up
- If the checkbox was selected before, you cannot edit it. If the checkbox was not selected before, you can edit it.
- Click Save
Note: You can also edit a published dashboard and when you update it, this change will be visible to all users.
Delete Dashboard
- Click Actions and Delete on the top right corner
- Click Delete