AI Reports & Insights
This page leverages cutting-edge AI to deliver in-depth energy analytics, transforming raw data into actionable operational intelligence. Going beyond simple alarm monitoring, it intelligently correlates energy consumption with efficiency indicators. The system generates tailored optimization recommendations complete with projected savings estimates, all presented through this intuitive interface.
You can use it to:
- transform raw data into actionable operational intelligence, delivering deeper energy consumption analysis
- help you to reduce energy costs, enhance efficiency, and make smarter operational decisions.
View Dashboard
View Energy Consumption Diagnosis
Tips: If there is some access limited, please contact Akila deliver team for help. If you view "Go to Data Source Management" and "Go to Monitoring Point Management" when entering this page, please make the configuration firstly.
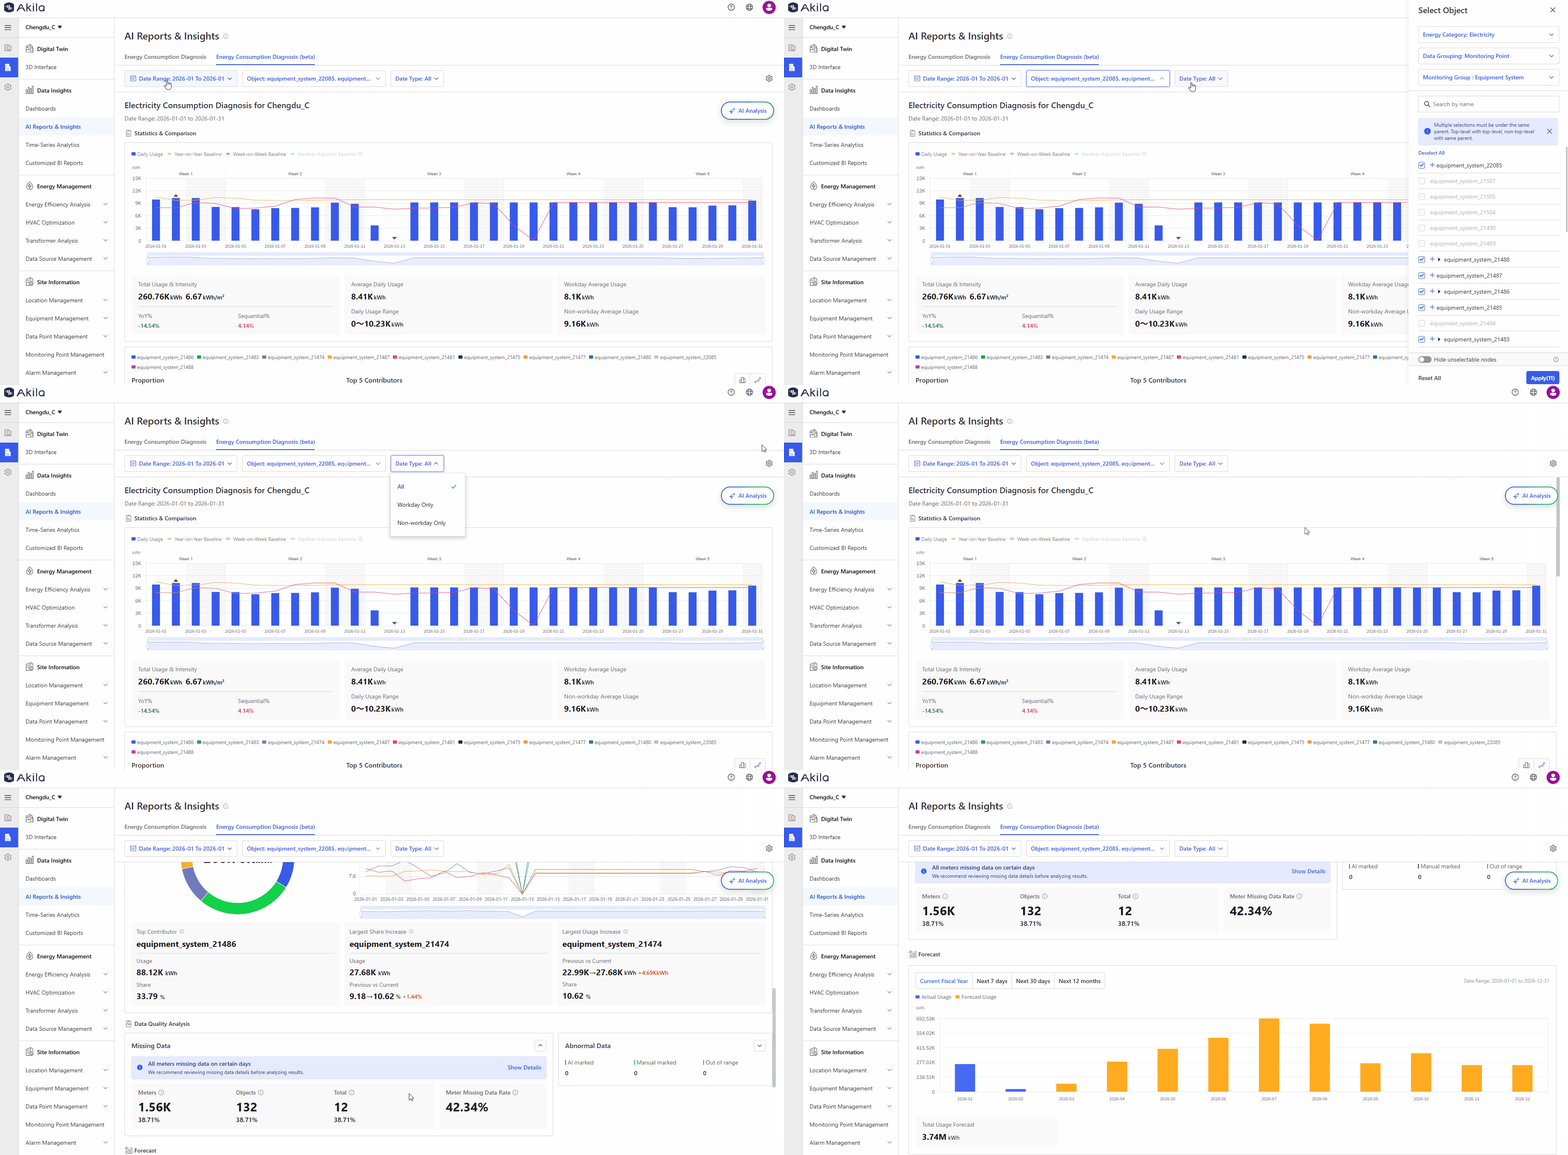
- Select Date Range and Objects
- Select Date Type
Notes: This is set on the Site Settings page. - Click Settings
Notes: You can set the expected interval and choose whether to switch to interpolation mode. The expected interval you set here can help you define how many numbers of data you should receive, which can help you to count the missing data rate. - View Statistics & Consumption
Notes: AI will give you corresponding insights to make better decisions. The highest usage bar displays a red superscript indicator, while the lowest shows a green subscript. You can also click the legend to show its sub-level monitoring point and you can also view the details. - View Data Quality Analysis
Notes: AI identifies irregularities. It includes missing data and abnormal data. You can also view the missing data by meter, object, day and interval by clicking "Show Details" - View Forecast
Notes: If the selected time range has fully elapsed, no forecast usage is generated. The chart shows actual usage only. - Click AI Insights
Notes: AI will generate the insights automatically. If you don't wanna view some insights, you can click "Stop Analysis" You can now drag the floating button to any preferred position, and freely move or resize the expanded panel (width/height) to suit your workflow. When the AI identifies an object worth attention, it no longer stops at the alert. It can autonomously request child-level breakdown data, analyze the returned evidence, and progressively narrow down to the most likely next-level investigation target, with clear reasoning provided.
View Operating Hours Insights
- Click "Report Configuration" if there is no data or settings icon if there is report
- Select Base Zone (Optional)
- Select Functional System Type (Optional)
- Select Monitoring Object
- Select rules analysis or ai analysis
- Add Schedule
Notes: Select the day and operational hours - Input Electricity Price (Optional)
- Click Analyze