Raw Data Point
"Raw Data Point" refers to a specific piece of information or a measurable value associated with a piece of equipment or sensor. "Raw Data Points" in Akila represent the link between real-time data coming from sensors, actuators, or other devices, and the Akila platform. They are associated with a piece of equipment, which can be anything from a large piece of equipment being monitored and controlled by a BMS, to an individual IoT sensor device.
Data point means that point can generate time-series data.
| Term | Description |
|---|---|
| Preset Calculated Data Points | A cumulative concept, such as energy, that can be used for usage calculations. |
| Instantaneous Value Data Points | An instantaneous concept, such as temperature, humidity, and only collects data at that moment. |
| Status Data Points | The state of a piece of equipment. It can indicate the operational state of a piece of equipment, for example, on or off. |
| Reading Out of Normal Range | Reading less than 0 or exceeding the upper limit of 99999999999999999.9999. |
You can use it to:
- Provide valuable insights into the operational health of equipment.
- View the meter readings and usage associated with the raw data points within the selected time frame.
Prerequisite: A prerequisite for viewing data on this page is completing the Quick Start process and the data point matching process, which can be completed by contacting the Akila Delivery Team.
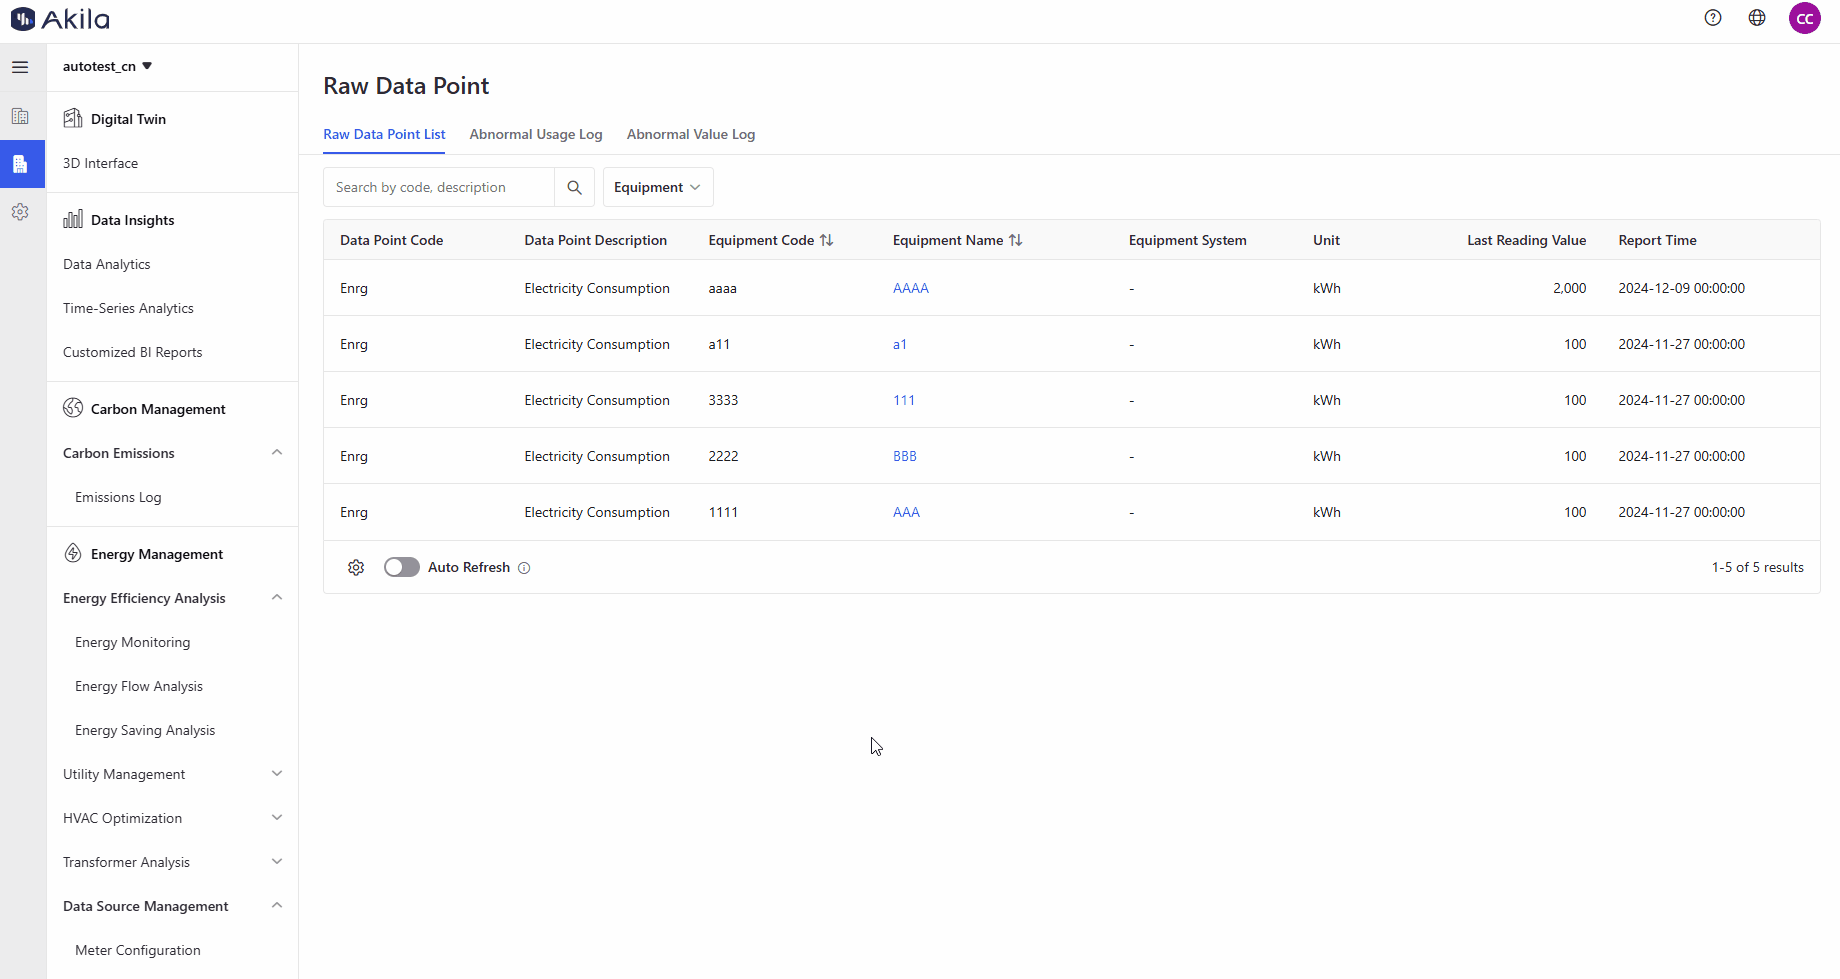
Raw Data Point List
View Raw Data Point
- You can search for the data point you want to view through the search box, and you can also use the equipment filters next to it to select the data point.
- You can enable sorting for "Equipment Name" and "Equipment Code" in the tab by clicking the icon beside them.
- Click on a data point in the list to navigate to the corresponding detail page.Note: The detail page will display the basic information of the data point as well as the associated equipment and location information. Clicking on the corresponding equipment or location name will also navigate to the detail page of that equipment or location. You can switch between the "List" or "Chart" tabs, with the list displaying data in tabular form and the chart displaying data graphically.
- Click the "Go to Time-Series Analysis" button.
Note: If you want to view more data, you can click this button to go to the Time-series Analytic page. - Toggle "Auto Refresh" in the bottom left corner of the page.Note: The "Last Reading Value" and "Report Time" will refresh automatically when this button is enabled.
Abnormal Usage Log
View Abnormal Usage
- You can search for the data point you wish to view through the search box, and you can also use the equipment filters next to it to select the data point you want to view.
- Click on a data point in the list page.
Note: The AI-suggested usage column in the data point list will automatically replace the original abnormal usage and will be directly applied to where the usage needs to be calculated, displayed in the chart or time series the next day. If there is any abnormal usage not detected by AI, it will be shown as “-” in this column, and it will also be displayed as “-” when editing the abnormal usage. - Jump to the corresponding detail page.
Note: The detail page will display the basic information of the data point as well as the associated equipment and location information. Clicking on the corresponding equipment or location name will also take you to the detail page of the corresponding equipment or location. You can also switch between the "List" or "Chart" tabs; the list presents data in a tabular format, while the chart presents data graphically. - Click the "Go to Time-Series Analysis" button.
Note: If you want to view more data, you can click this button to go to the Time-series Analytic page.
Edit Abnormal Usage
-
Find the abnormal usage entry you want to edit and click the "Edit" icon in the log list.Note: You can also click "Edit" on the raw data point detail page. This applies to calculated value data points.
-
Display a pop-up window named "Edit Usage Log"
-
For data points with a status of "Normal," the status column will default to "Normal." However, if you believe the usage is abnormal, you can click on "Abnormal Usage" and refer to the AI-suggested usage to enter the correct value. After editing, the reason for the abnormality will change to "Manually Marked as Abnormal."
- For data points with a status of "Abnormal Usage," the status column will default to "Abnormal Usage." Refer to the AI-suggested usage to enter the correct value. After editing, the reason for the abnormality will remain unchanged.
- For data points with a status of "Abnormal Usage," if you change the status back to "Normal," there will be no abnormality reason after editing.
Export Usage Log
- Select the abnormal usage entries you want to export.Note: You can export up to 500 items at a time.
- Click "Export" on the lower left corner of the page.
- Click "Confirm" on the pop-up.
Batch Mark as Normal
- Select the data points you want to mark as normal.Note: Use this feature when you want to edit multiple abnormal data points simultaneously.
- Click "Batch Mark as Normal" on the lower left corner of the page.
- Click "Confirm" on the pop-up
Abnormal Value Log
View Abnormal Value
- You can search for the data point you wish to view through the search box, and you can also use the equipment filters next to it to select the data point you want to view.
- Click on a data point in the list page.
- Jump to the corresponding detail page.
Note: The detail page will display the basic information of the data point as well as the associated equipment and location information. Clicking on the corresponding equipment or location name will also take you to the detail page of the corresponding equipment or location. You can also switch between the "List" or "Chart" tabs; the list presents data in a tabular format, while the chart presents data graphically. - Click the "Go to Time-Series Analysis" button.
Note: If you want to view more data, you can click this button to go to the Time-series Analytic page.
Edit Abnormal Value
- Find the abnormal value entry you want to edit and click the "Edit" icon in the list.Note: You can also click "Edit" on the data point detail page. This applies to instantaneous value data points and status value data points.
- Display a pop-up window named "Edit Value"
- Change normal status to abnormal
Note: For data points in the list with a status of "Normal," the status column will default to "Normal." However, if you believe the status is not normal, you can click on "Value Abnormal". - Select the reason for abnormality.Note: If the selected reason is "Meter/Sensor Anomaly" or "Data Transmission Failure", you need to input a redefined value (when the data point is instantaneous data) or select a dropdown option (when the data point is status data). If the selected reason is something else, you can proceed to the next step. When you change the abnormal reason from "Meter/Sensor Anomaly" or "Data Transmission Failure" to another reason, you can no longer edit the redefined value.
- Input notes(Optional)
- Click Save
Export Abnormal Value
- Select the abnormal values you want to export.Note: You can export up to 500 items at a time.
- Click "Export" on the lower left corner of the page.
- Click "Confirm" on the pop-up.